GIS Assets for Local Authorities
The National Computer Board is implementing a Geographical Information System - GIS-based system to compile and monitor various assets of all 12 Local Authorities (Municipalities & District Councils) under the Ministry of Local Government, Disaster and Risk Management. The NCB, as the technical partner, is rolling out the GIS system based on open source technology, which would bring major savings for the Government of Mauritius in terms of licensing as compared to commercial systems. The NCB, through its Government Online Centre (GOC) Data Centre, is providing the IT infrastructure.
The project allows the compiling and geo-tagging of various assets (electric poles, roads, drains, buildings etc..) on a visual GIS dashboard and easily allow officers to monitor and edit these assets (repairs, maintenance) and take remedial actions accordingly. Data collection is being achieved through a mobile App used by field officers or virtual tagging on the GeoServer.
The infrastructure at the GOC has been set up for hosting all assets’ data, the GIS software and applications as well as secured connectivity. The GIS Assets is being integrated with the Council Project Management (CPM) which is a web-based platform which caters for operations of various departments, council committees; follow up of projects and amongst others. This would allow the Local Authority to closely monitor assets in near real time.
Future systems such as Fleet Management and Permits & Licenses will be eventually incorporated with the GIS system. The Fleet Management enables the vehicles of Local Authorities to closely monitor their daily tracks, fuel consumption, servicing and maintenance. The GIS system will integrate with the fleet management system with the use of appropriate IoT sensors. This will help Local Authorities visualize and monitor their vehicles on a real time basis.
The pilot project has been deployed at one LA namely District Council of Moka (DCM). Officers have been trained for using the GIS system and they have nearly completed the asset tagging. During the next phases, the project will be replicated for the remaining 11 Local Authorities and thus again providing the IT Infrastructure and training.
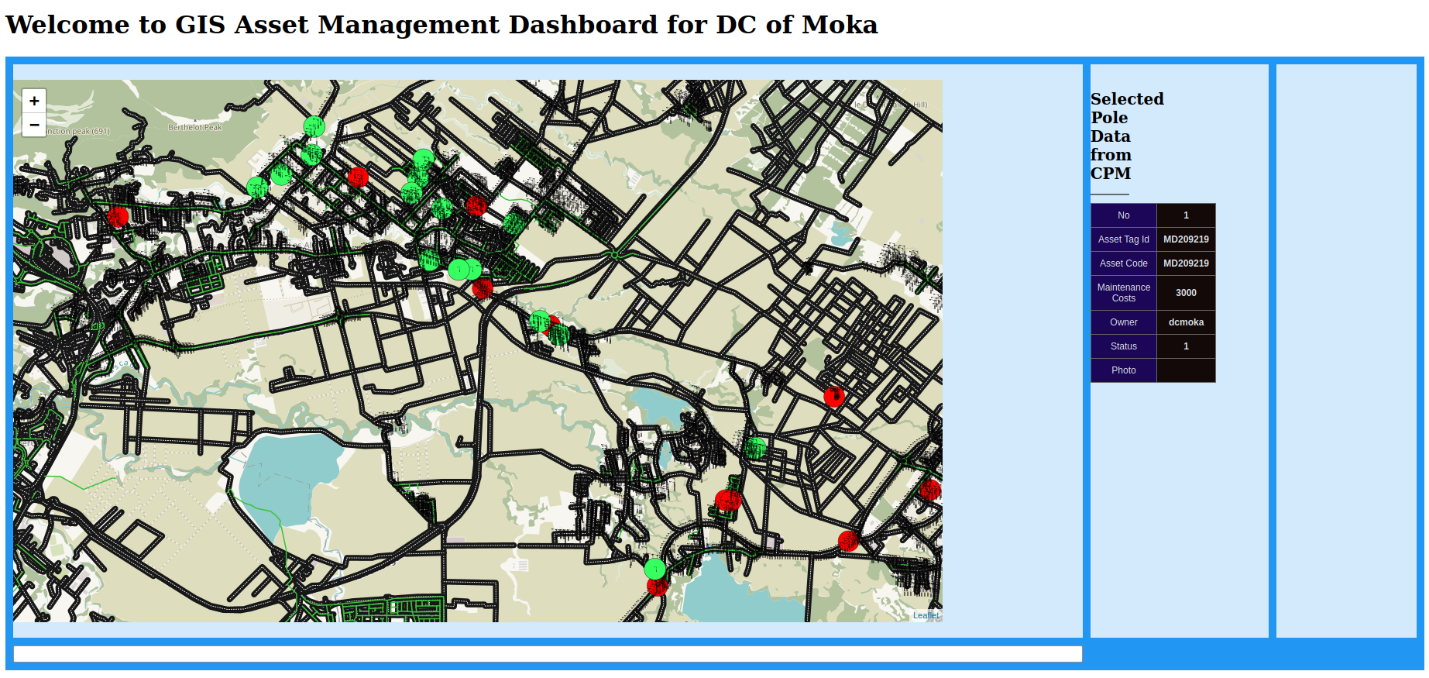
The results obtained from the successful deployment of the pilot site now enables officers to quickly monitor the status of various assets, flag any faults or issues which are easily viewed on a map. The dashboard can be accessed by technical and senior management for near real time remedial actions. The project is a shift from manual processes to an efficient GIS based monitoring of assets and flagging of alerts. The system allows simultaneous access by multiple officers and enables more efficient decision-making.
GIS Asset Management Dashboard
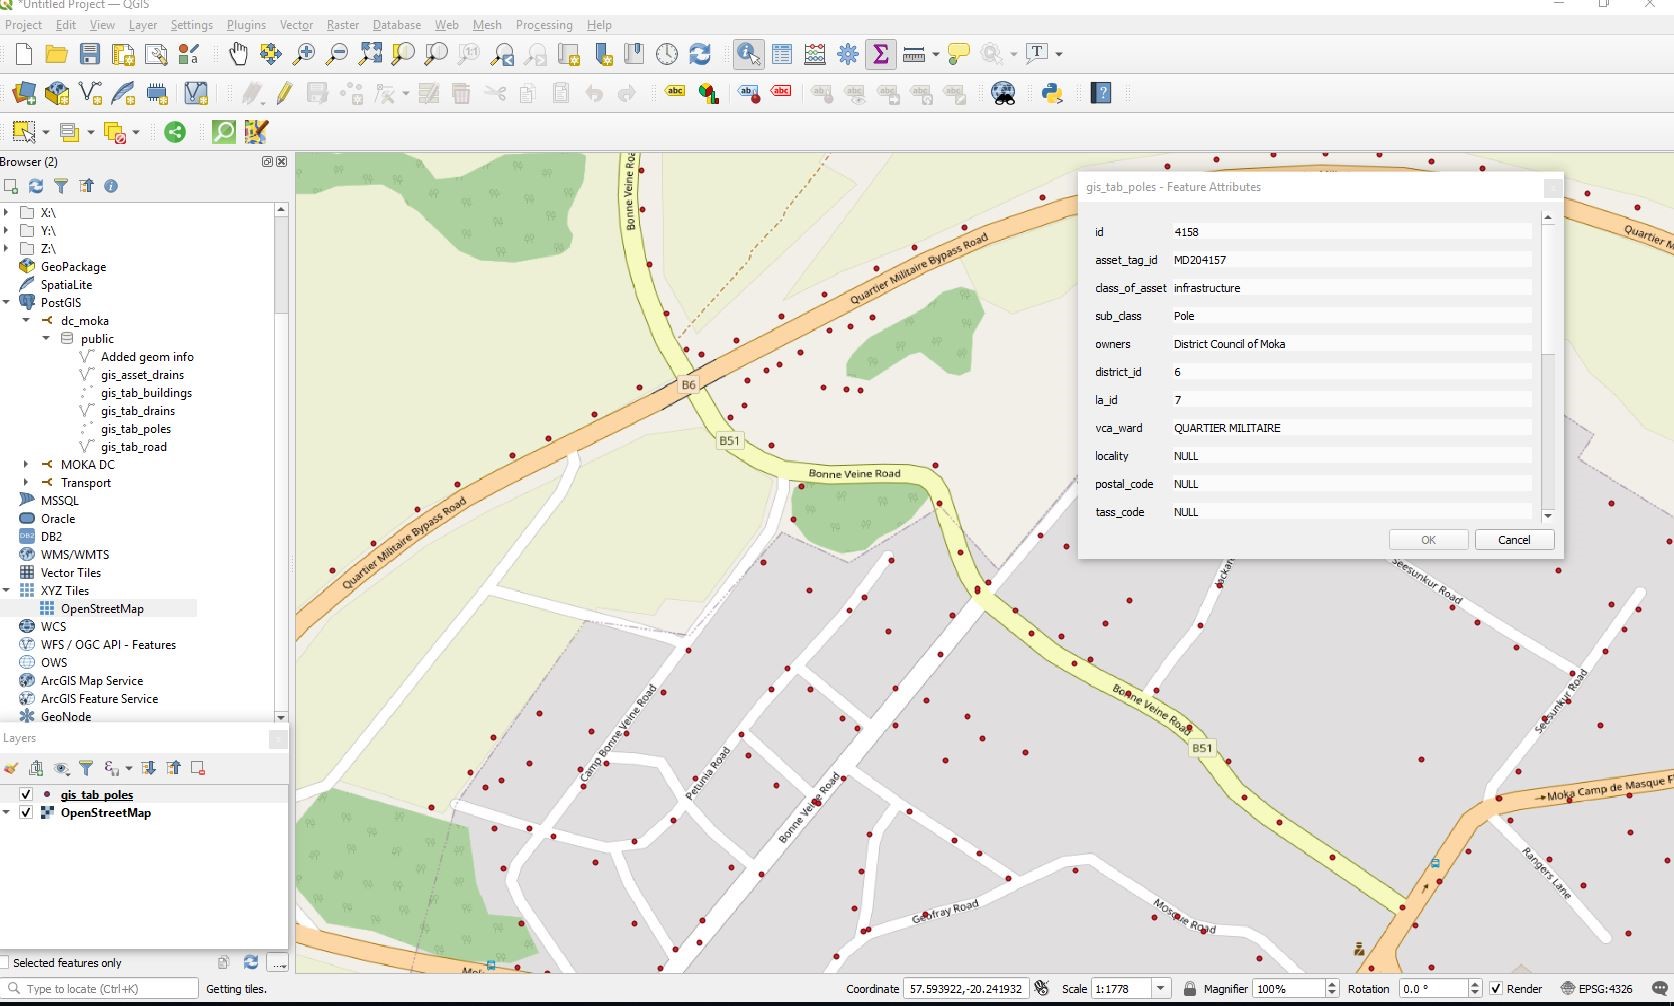
Accessing Asset through Open Source QGIS and connected to Geoserver
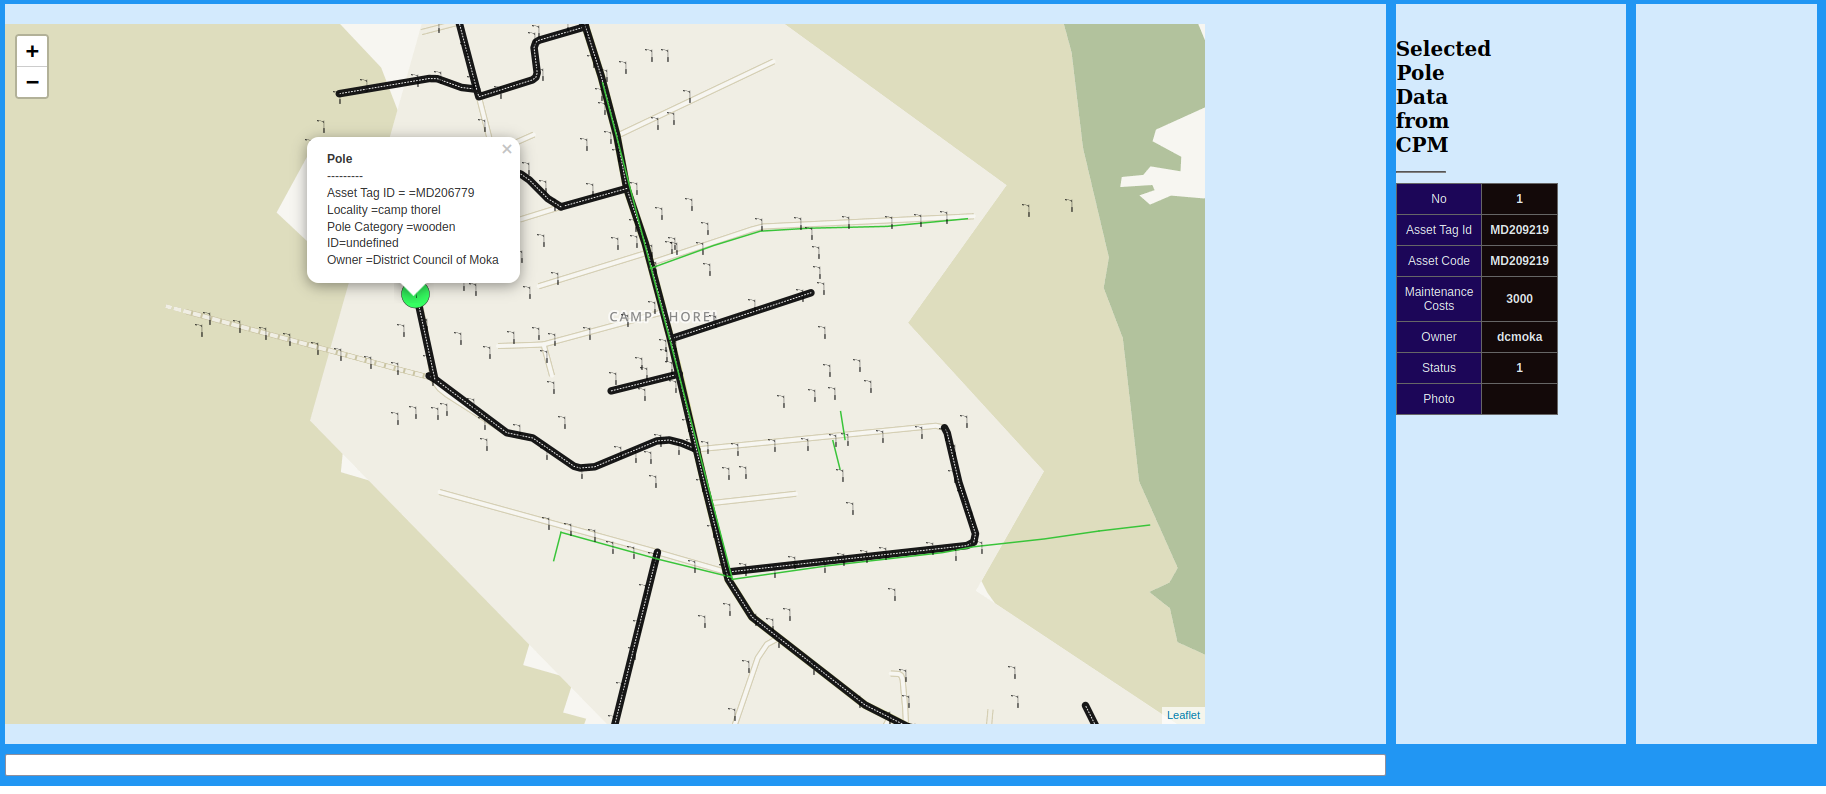
Asset Poles:
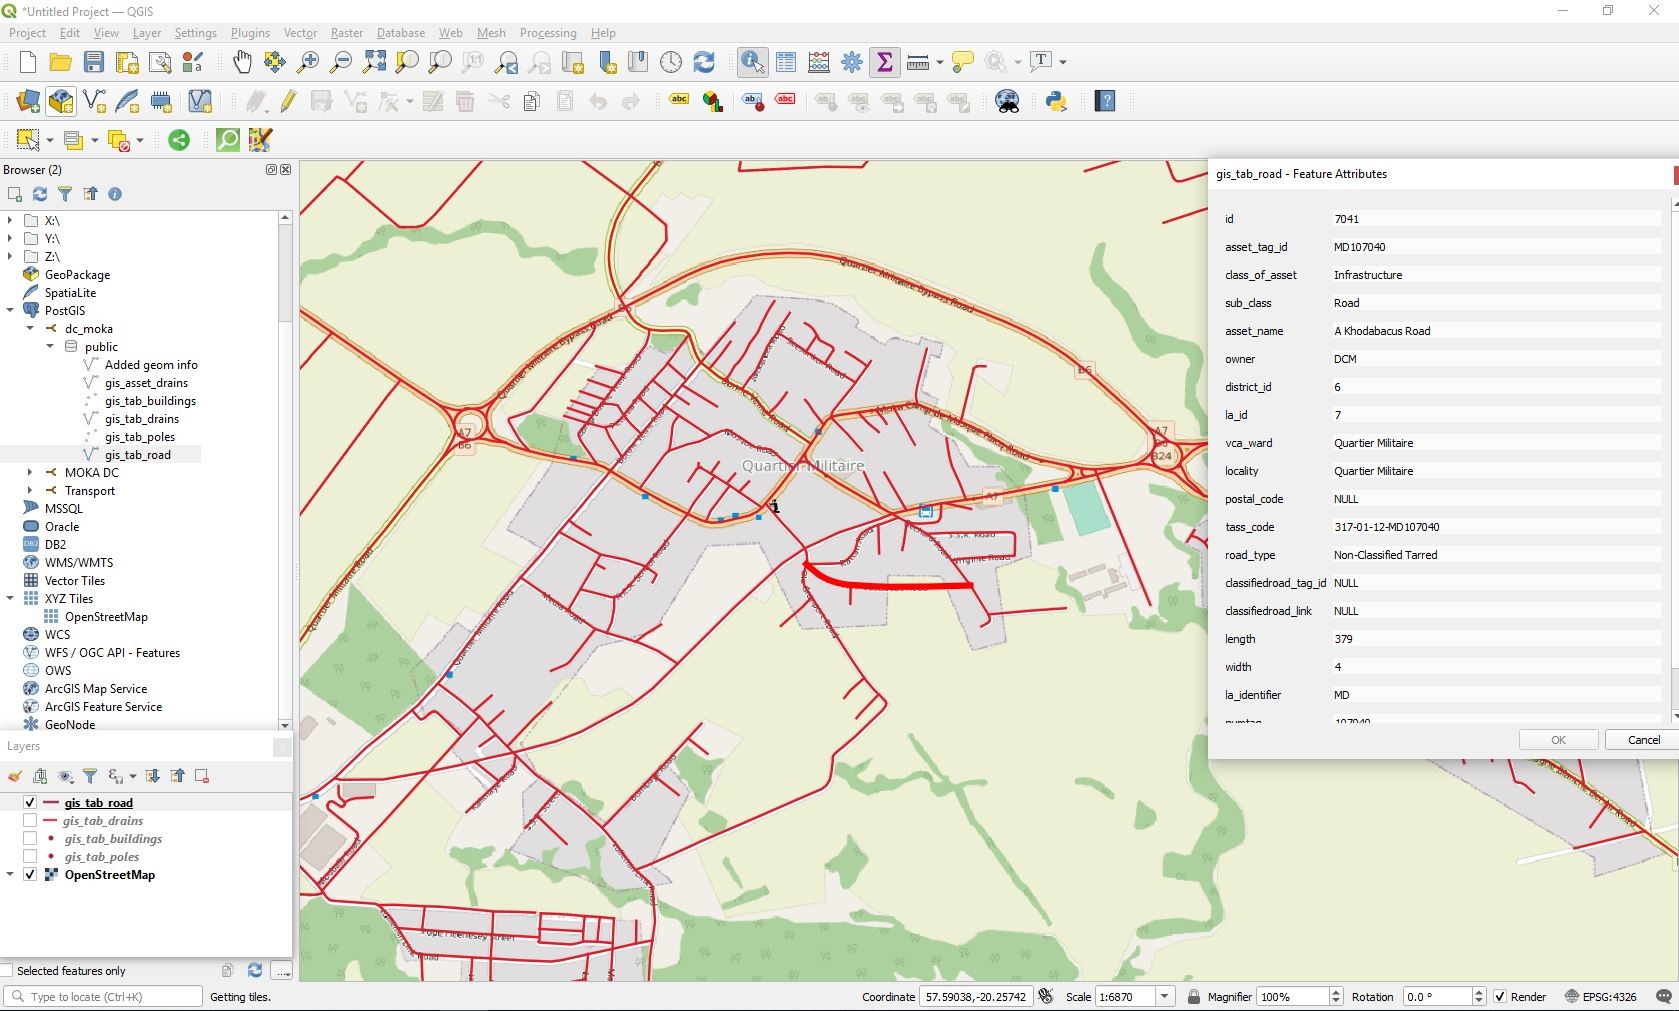
Assets Roads:
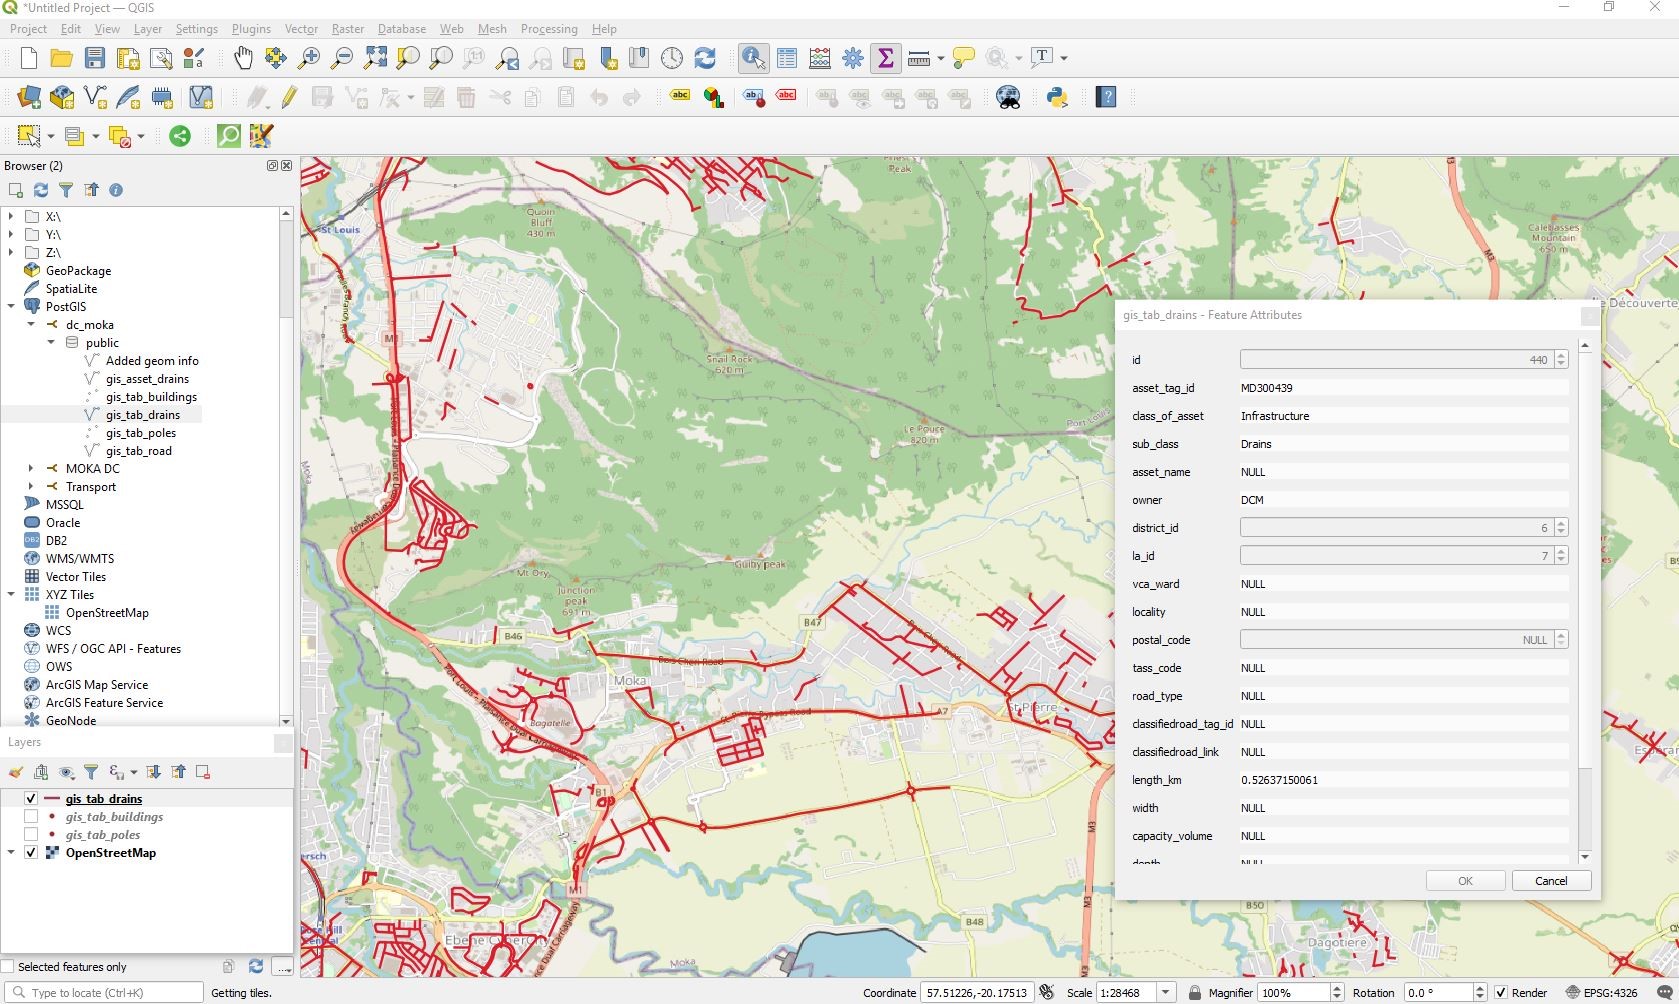
Assets Drains:
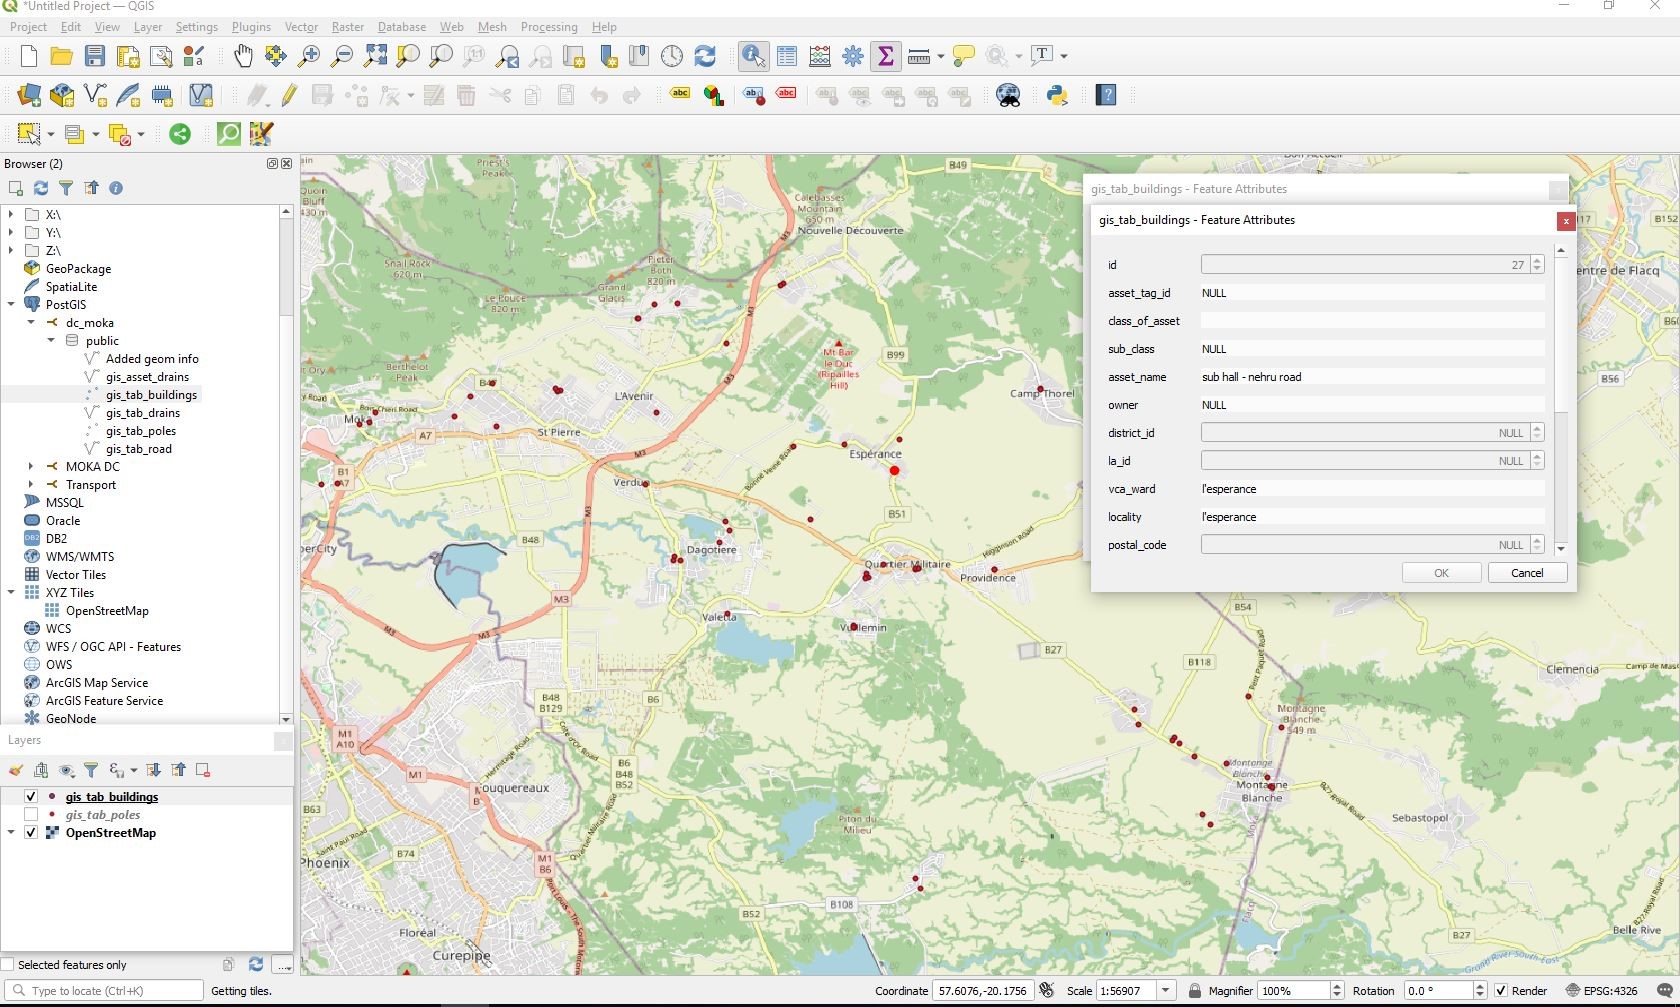
Assets Buildings:
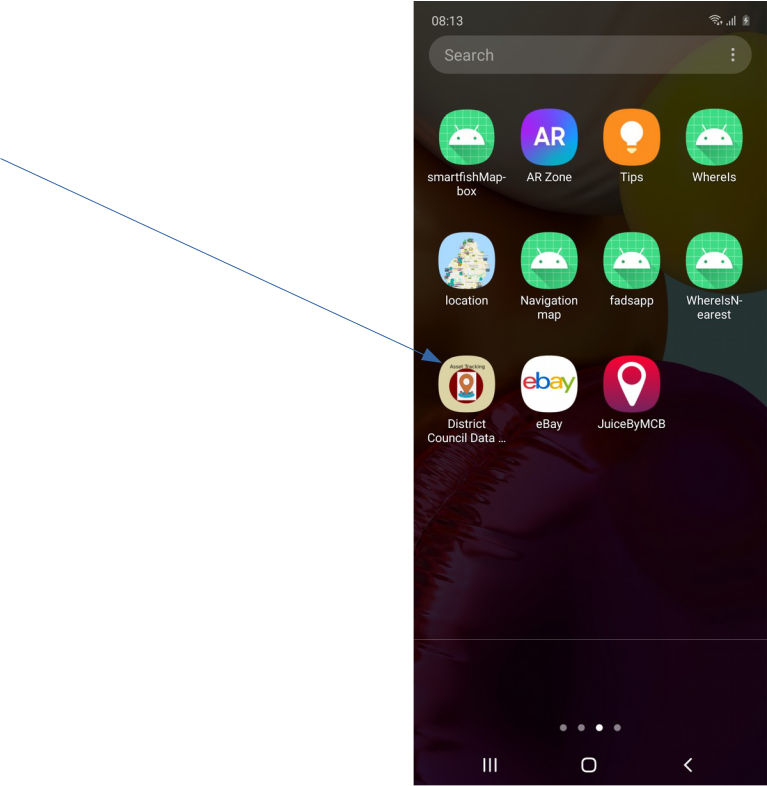
Mobile App for data collection and geo-tagging of assets
App Icon
Login screen : prompts for a username and password.
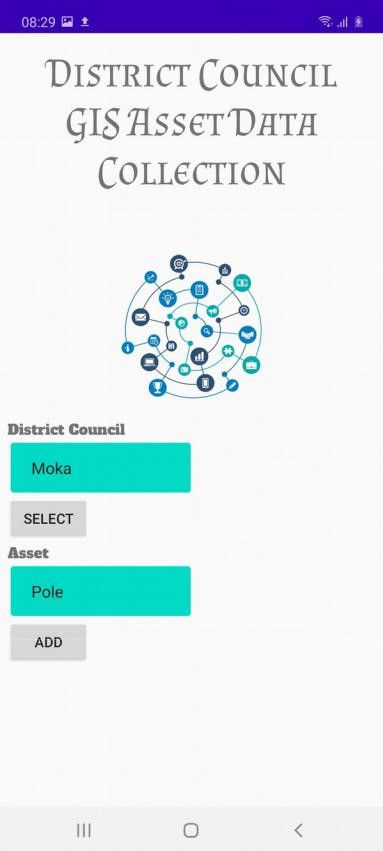
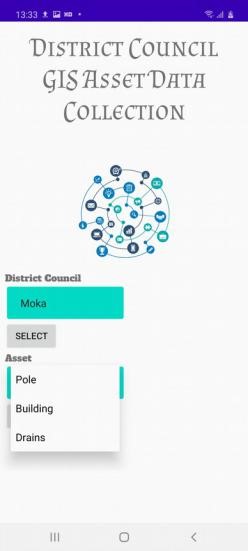
Using the application for Asset Data Collection
After successful login, the User will select the appropriate Local Authority (LA) from a drop down list. Next the User will pick an asset class, also from a drop down list.
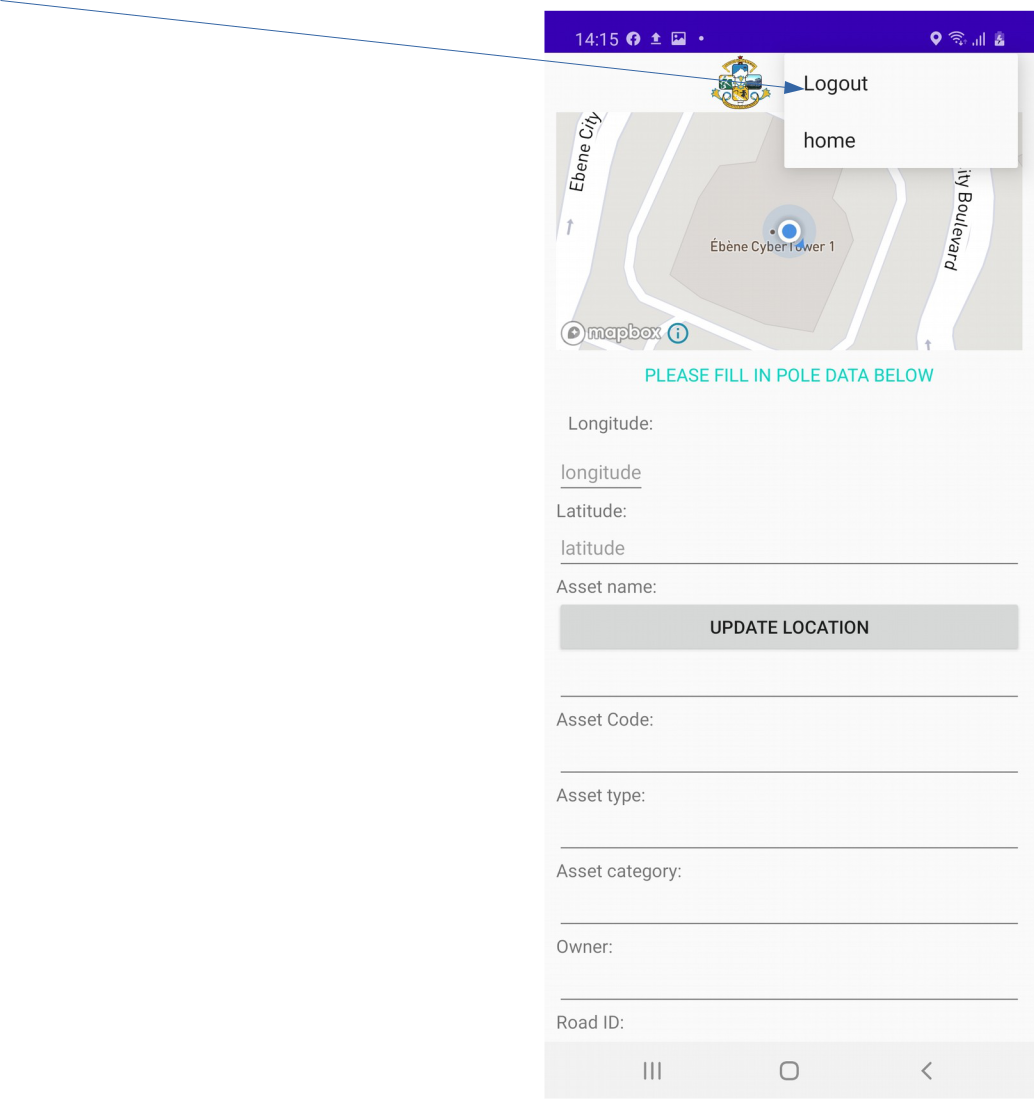
Pole Data
When asset pole is selected for data collection, the pole data form will launch as shown below:
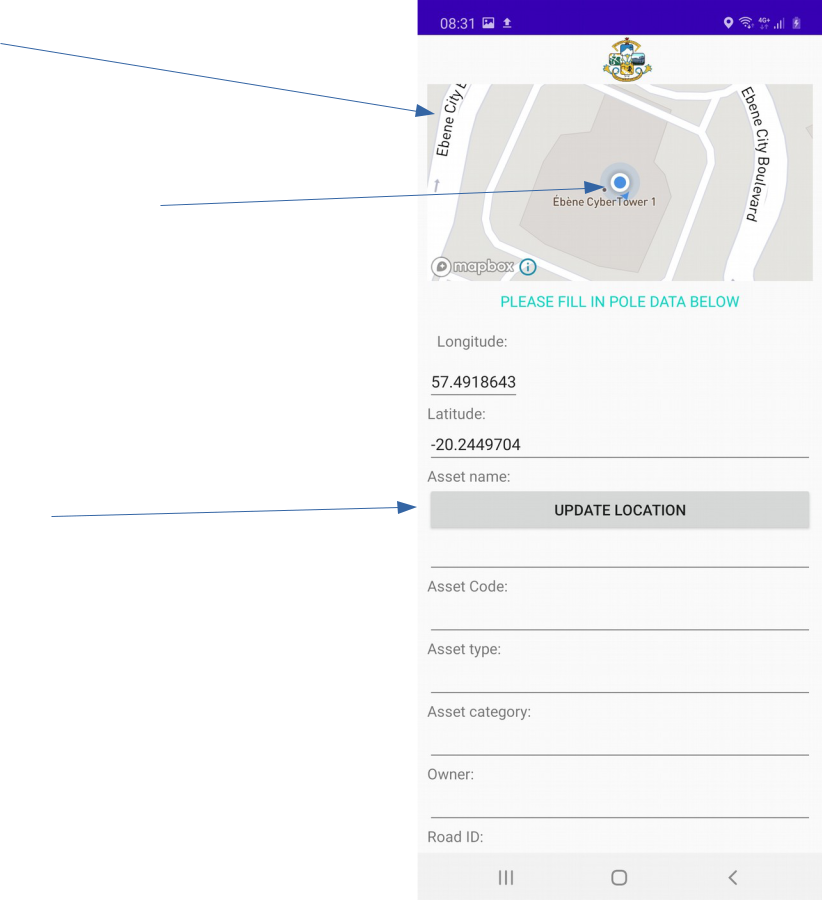
As soon as the pole data screen is loaded, the current location will be displayed as shown above.
Before capturing the location of the pole, user must ensure that the exact location of the pole is updated using the update location button. User will also view his real-time location on the live map.
Once the exact location of the pole has been received, user can proceed filling all the other fields data for the pole.
After filling all the fields user will press the submit button to save the data
Building Data
Before capturing the multi-point locations of the drain, user must ensure that the exact starting point location of the drain is updated using the Get Position button as shown above. User will also view the real-time tracking and location on the live map.
The user then proceeds to the next point while monitoring his movement on the live map.
A distance of above 2 metres from the first starting point is recommended before adding the next point of the drain. Before pressing ‘add more coordinates’ button, user updates the location of the point using the get position button.
Using the add more coordinates button, user will repeat steps above adding more points as required to capture the full length of the drain.
Once all the points of the drain have been captured, the user will proceed to fill up all the other fields on the data collection form before pressing the submit button
Log Out
The user logs out of the application while pressing logout on the menu from the toolbar as shown.